The images below are taken from slides by Linda Shapiro at University of Washington.
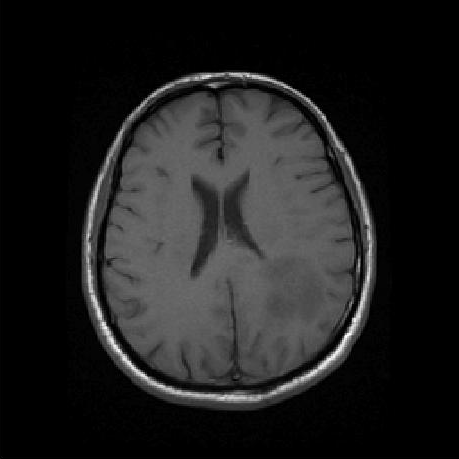
Here's a T1-weighted slice through a brain:

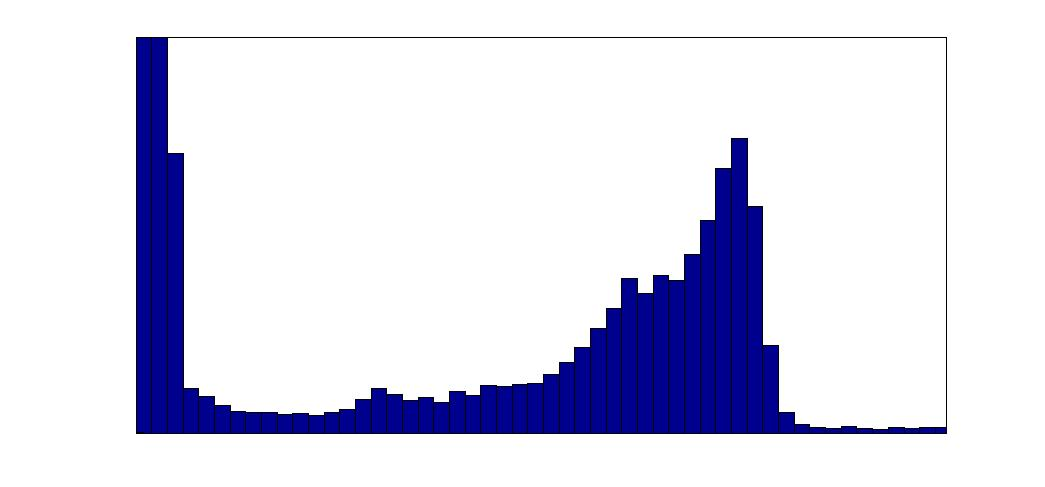
And here's the image's histogram:

The histogram shows the number of times each pixel value occurs in the image. Low pixel values (on the left of the histogram) occur many times because there are many dark background pixels. The peak toward the right corresponds to the mid-level pixel values of the grey matter.
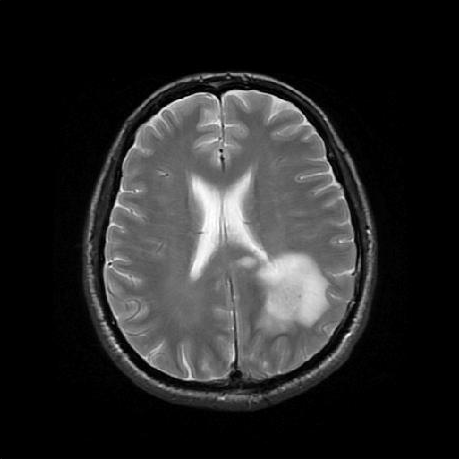
This is a T2-weighted slice of the same brain:

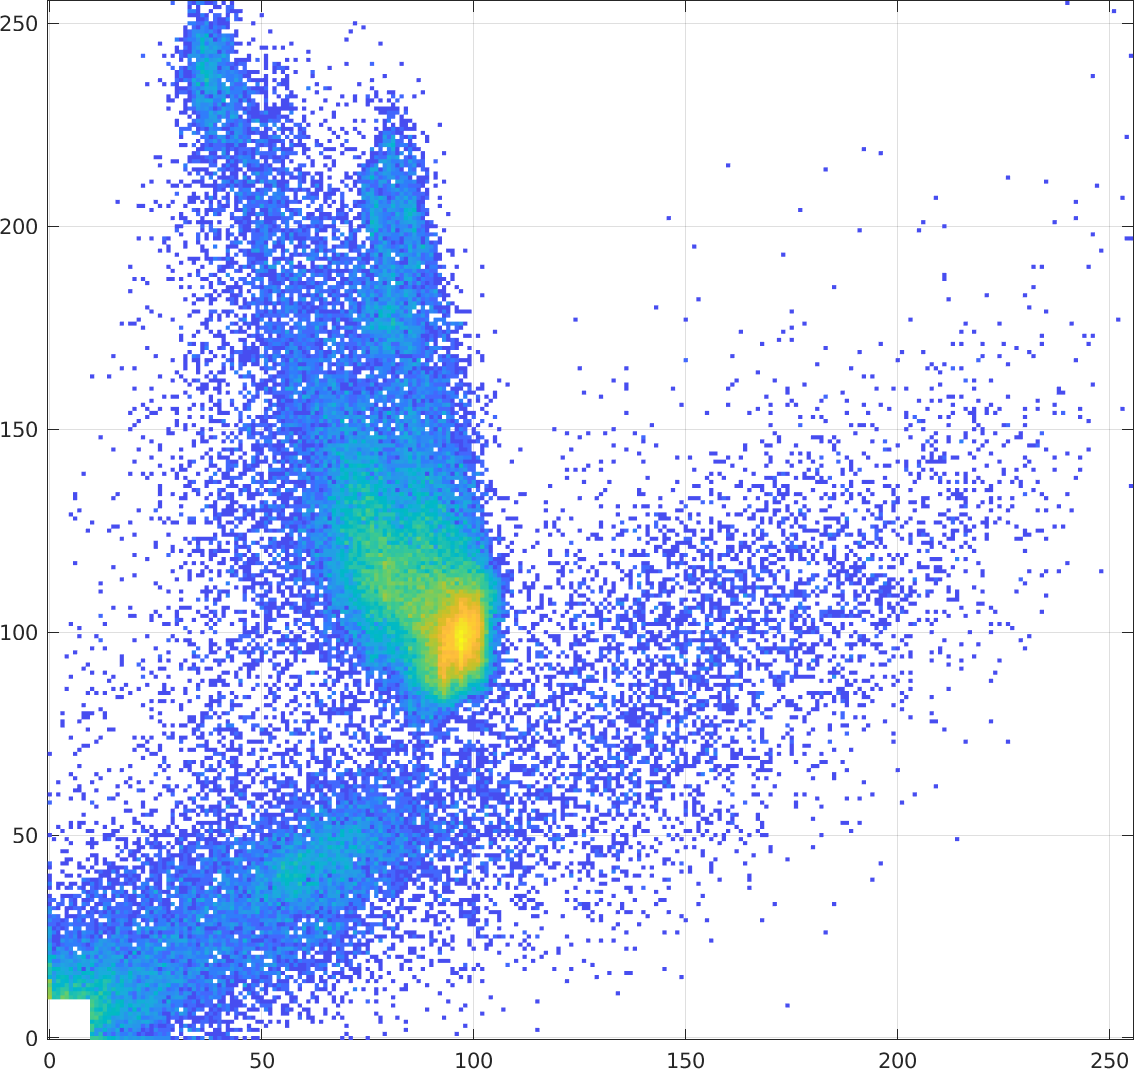
And here's the joint histogram of the two images:

The joint histogram, $h(x,y)$, has grey values of the T1 image on the $x$ axis and the grey values of the T2 image on the $y$ axis.
A pixel at $(x,y)$ in the joint histogram shows the number of times that value $x$ in the T1 image and value $y$ in the T2 image occur in the same place. In other words,
$h(x,y) = \sum_{i,j} \left\{ \begin{array}{ll} 1\ \ \textrm{ if } \textrm{T1}(i,j) = x \textrm{ and } \textrm{T2}(i,j) = y \\ 0\ \ \textrm{ otherwise } \end{array} \right.$
The brighter (yellower) areas indicate larger counts, while the bluer areas indicate smaller counts and white areas have zero counts. The values in $[0,10] \times [0,10]$ are removed because they correspond to background pixels and have very large counts, which would overwhelm the other counts.
The joint probability, $P(x,y)$, is the probability that pixel values $x$ and $y$ occur at the same place in the two images:
$P(x,y) = \frac1N h(x,y)$
for $N$ overlapping pixels. Note that the histograms of the individual images are the sums of the rows (for T2) or columns (for T1).