The Hough Transform is a method to find features in an image.
With Hough, we typically apply edge detection first, and then apply the Hough Transform to the resulting edge pixels. So the Hough Transform usually has a binary image as its input.
A common application of the Hough Transform is to detect straight lines in an image. These lines are usually parts of objects or features that we're searching for in the image.
The main idea is that each edge pixel gets to vote for all the possible lines that it might be on. Then lines with the most votes are output.
For example, consider an image of only three edge pixels, which are shown below as little squares. Each of the three pixels votes for all of the 16 lines that pass through that pixel (16 because we have limited this example to 16 line directions).
There is one line, shown in red, that gets three votes, while the other lines each get one vote. So the Hough Transform would output the line with three votes as the most likely line in this image.
Hough is very good at detecting incomplete features, like the line above which has pixels missing between the three edge pixels.
For each pixel, we need to know the equations of all lines that pass through that pixel. There are two equations that we're familiar with:
The parameter space of a line is the space of all possible values of the line parameters.
We will not use the $\langle m, b \rangle$ space because it is very poor at representing steep (and vertical!) lines because the slope, $m$, is very large (or infinite) for those lines.
The $\langle \theta, r \rangle$ space is much better. For example, vertical lines simply have their $\theta$ equal to $0$ or $\pi$.
Suppose we have two edge pixels in an image at positions $(2,1)$ and $(3,3)$. For what lines do these pixels vote?
To find which lines $(2,1)$ is on, substitute $(2,1)$ into the line equation $$r = x \cos\theta + y \sin\theta$$
to get $$r = 2 \cos\theta + 1 \sin\theta.$$
All lines that pass through $(2,1)$ satisfy the equation above.
Similarly, the point $(3,3)$ is on all lines that satisfy the equation $$r = 3 \cos\theta + 3 \sin\theta$$
We saw, back when we were discussing the Real Fourier Series, that these are the equations of shifted, modulated sinusoids in the $\langle \theta, r \rangle$ space.
Below is a plot of those two sinusoids:
Take a moment to get a good intuition for what's going on in the plot above:
The purple curve traces through all points in the $\langle \theta, r \rangle$ parameter space that satisfy the equation $$r = 2 \cos\theta + 1 \sin\theta$$
Each $(\theta,r)$ on that curve represents one line that passes through $(2,1)$.
And the blue curve does the same for $$r = 3 \cos\theta + 3 \sin\theta$$
where each $(\theta,r)$ on that curve represents one line that passes through $(3,3)$.
A point $(\theta,r)$ that is common to both curves represents a line that passes through both $(2,1)$ and $(3,3)$.
In the plot above, the two points of intersection are at $(0.85 \pi, -1.34)$ on the left and $(1.85 \pi, 1.34)$ on the right.
Plotting the lines corresponding to those two intersection points yields this:
| The line of $\mathbf{(0.85 \pi, -1.34)}$ | The line of $\mathbf{(1.85 \pi, 1.34)}$ |
|---|---|
Note how the polar coordinates $(\theta,r)$ and $(\theta+\pi,-r)$ represent the same line, above, which passes through $(2,1)$ and $(3,3)$.
Because of this redundancy, we usually only draw in the range $[0,\pi]$ instead of $[0,2\pi]$, as shown below:
![plot of two sinusoids in range [0,pi]](two-sinusoids-pi.png)
Each edge point (like $(2,1)$ and $(3,3)$ above) votes for all the possible lines that pass through it.
As we're using a computer for this, we have to discretize the $\langle \theta, r \rangle$ space into bins, each of which collects votes. This array of bins is called the accumulator array.
For a given edge point $(x,y)$, we iterate through a discrete set of $\theta_1, \theta_2, \ldots, \theta_n$ and, for each $\theta_i$, evaluate $$r_i = x \cos\theta_i + y \sin\theta_i$$
to get $(\theta_i,r_i)$. Then we add one vote to the bin at $(\theta_i,r_i)$.
Here are the bins and vote counts for the two example points:
To find the lines that are formed by the edge pixels, we scan through all the bins and pick those $(\theta_i,r_i)$ bins with the largest numbers of votes, and report the corresponding lines.
As seen above, where there are curves coming together, multiple bins might get larger counts. If this happens, we could, for example
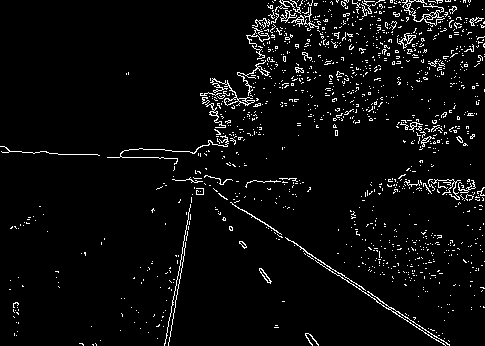
For self-driving cars, we would like to automatically find the edges of the road. One way is to perform Canny edge detection on a camera image, followed by the Hough Transform.
Here's an image of a road after applying Canny:

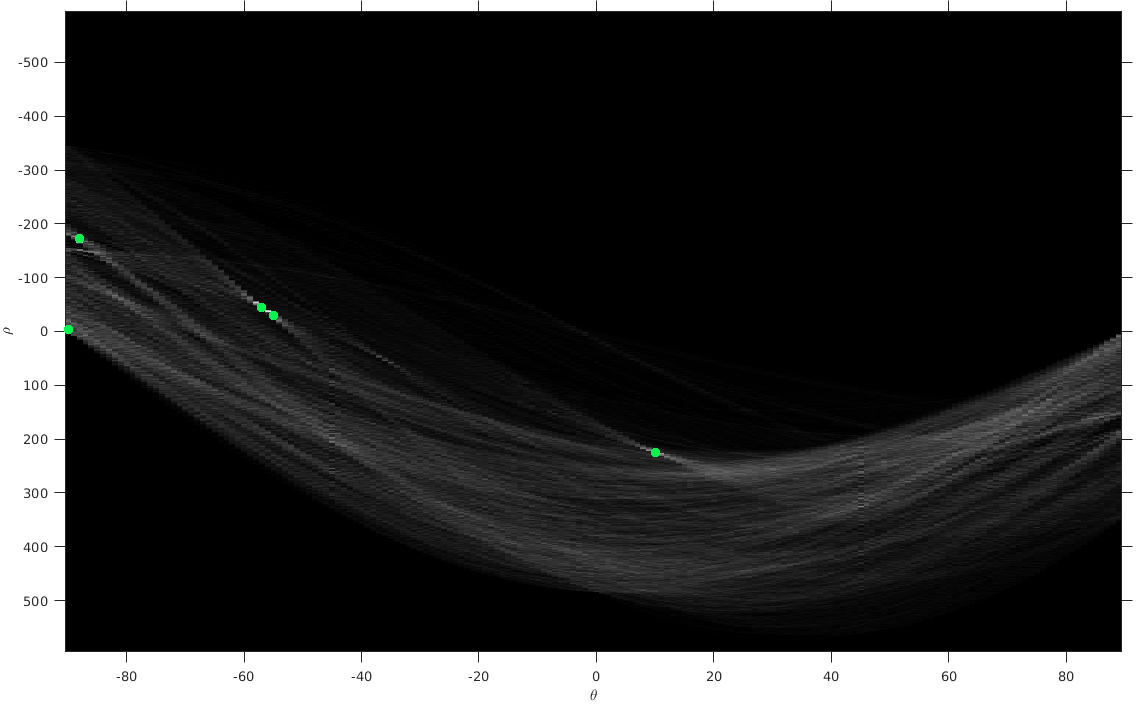
The Hough Transform of that image is shown below. Each cell in this accumulator array has brightness that is proportional to the number of votes in that cell. Five green dots indicate the cells with the highest numbers of votes.
Note that this accumulator array has angles $\theta$ in $[-90^o,90^o]$, instead of the $[0,\pi]$ that we discussed above. It doesn't matter: any range of width $\pi$ will provide the same information.

Finally, here are the five lines corresponding to the five highlighted points in the accumulator array:

A self-driving application would probably select only those lines in a certain range of orientations, corresponding to the expected orientations of the edges of the road.
Can you identify which line corresponds to which point in the accumulator array?