If we can determine the amplitude and phase shift for each position, $k$, in the frequency domain, then we're done because an inverse Fourier Transform can compute the MRI image from the frequency domain information.
So how do we determine $A_k$ and $\theta_k$ for a particular $k$?
Waves in the Image
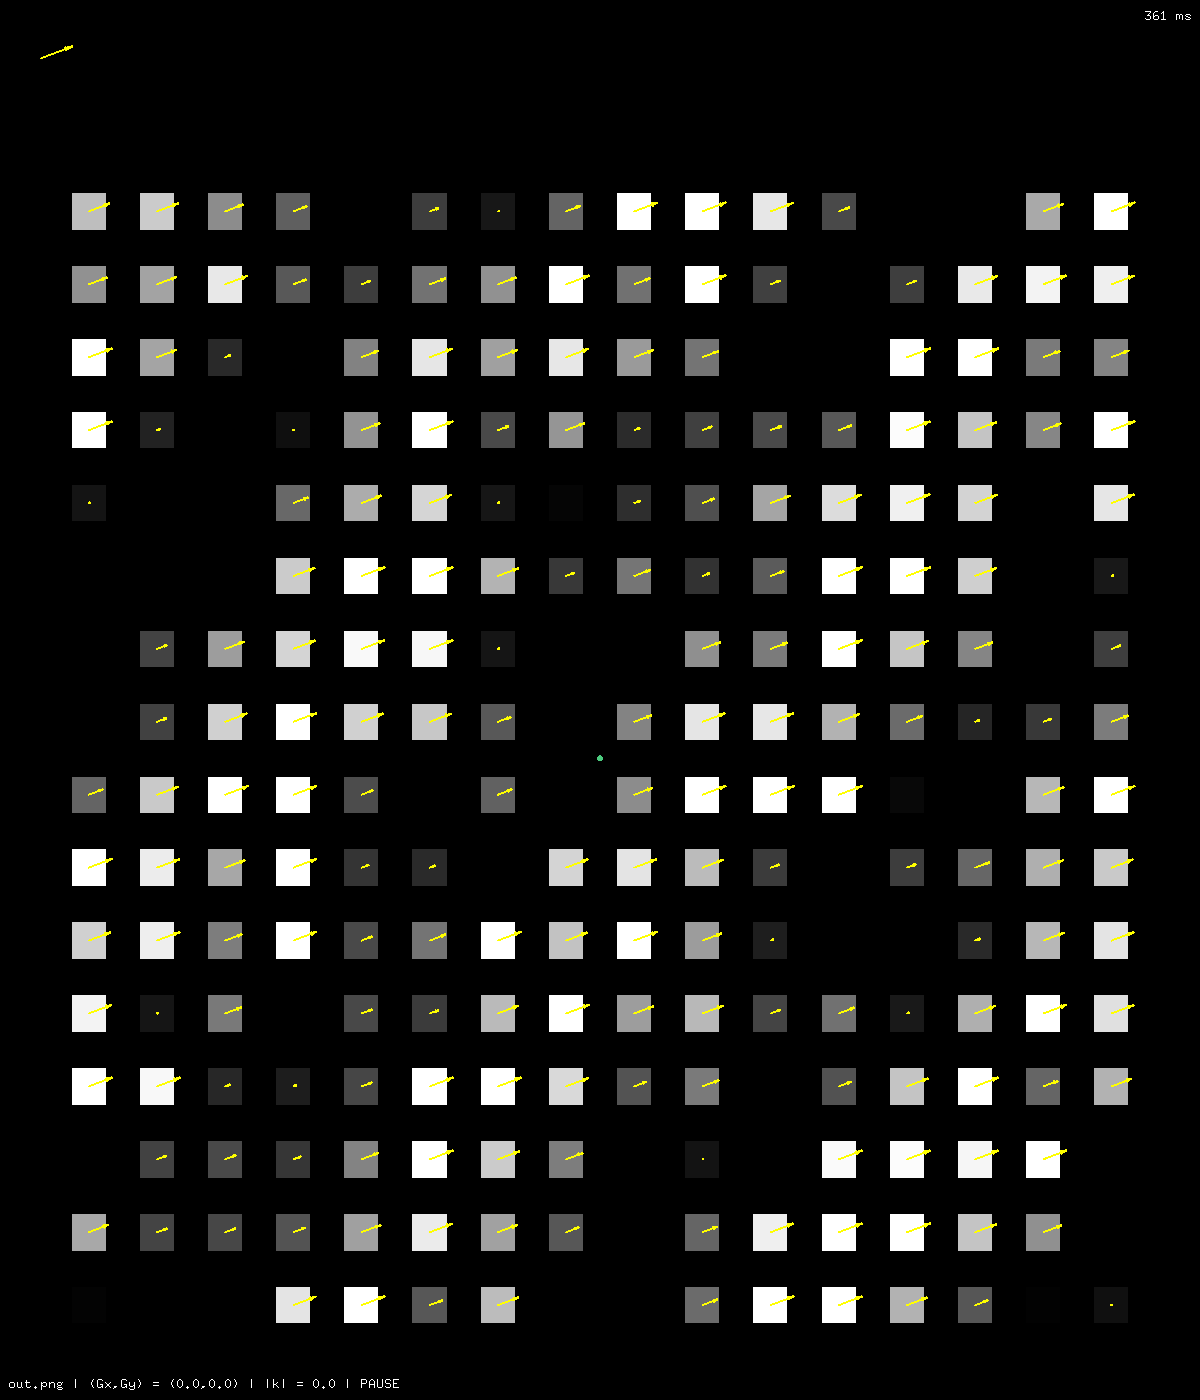
Consider a (fake) MR image that looks like this, where the brightness of a (large) pixel is proportional to the T2 value at that pixel. There are $16 \times 16$ pixels:

There's a sinusoidal wave in the bright and dark pixels (i.e. high and low T2 values).
The wave is moving diagonally across the image, so its wavevector, $k$, is pointed up and left (or down and right, equivalently).
And $k$ has wavenumber $|k| \approx 2.5$ because there are about 2.5 full cycles for each distance of $n = 16$ pixels.
This is one of the stronger sinusoidal waves that sum to form the MRI image. Its amplitude and phase should be recorded in position $k$ in the frequency domain.
There are many other waves in that sum, which correspond to the other positions in the frequency domain. But, in this example, those other waves will not contribute as much and will have lower amplitudes.
Determining Amplitude for a particular wavevector, $\mathbf{k}$
Initially, all the proton magnetic moments have equal magnitude. But after a bit of T2 relaxation, the magnitudes vary, as shown by the lengths of the yellow arrows below:

The "strength" of this wave (i.e. its amplitude, $A_k$) can be thought of as being proportional to the sum of all the T2 values on the wave peaks, minus the sum of all the T2 values in the wave valleys. Intermediate positions on the wave are counted with intermediate weights that vary sinusoidally between +1 (peak) and -1 (valley).
(This is really the projection of the image onto one of the Fourier basis functions. For more information, please see the CISC 457 notes.)
But we can measure only the aggregate signal from all of the individual magnetic moments.
So how do we make the moments on wave peaks have a positive contribution, and the moments in wave valleys have a negative contribution?
The key idea is to cause a phase shift such that the peak moments are 180$^o$ out of phase (i.e. pointed in the opposite direction) to the valley moments.
Then when all the moment vectors are added up into the aggregate moment, the peak and valley moments will point in opposite directions, with different "signs".
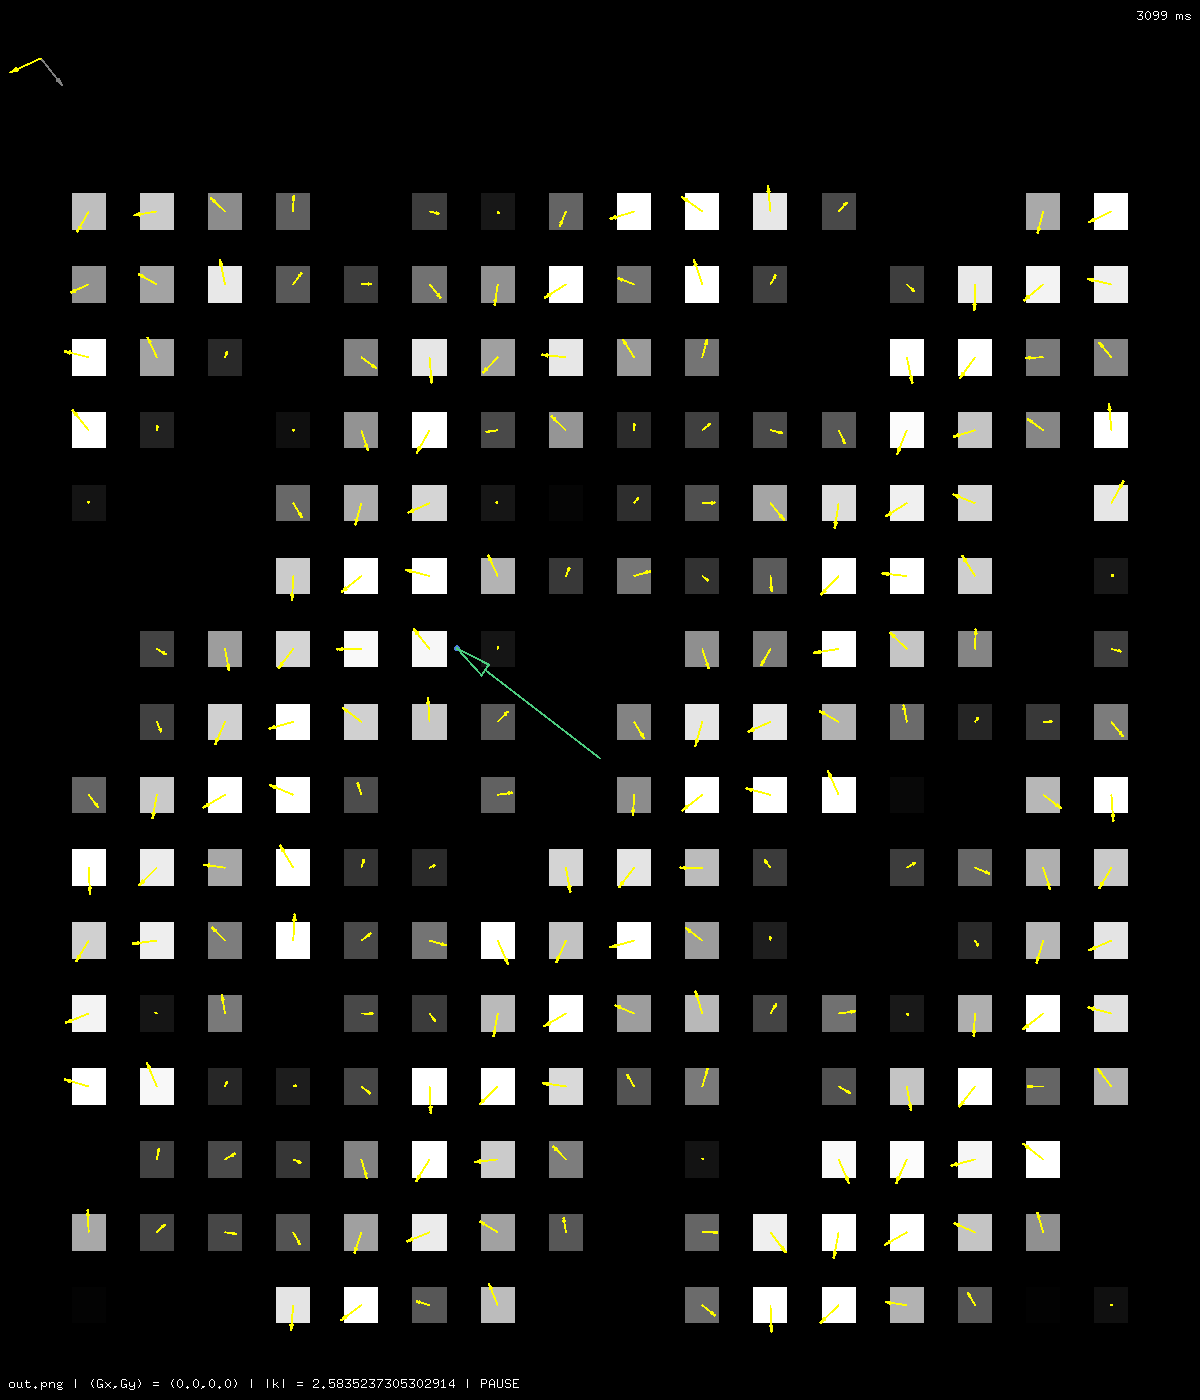
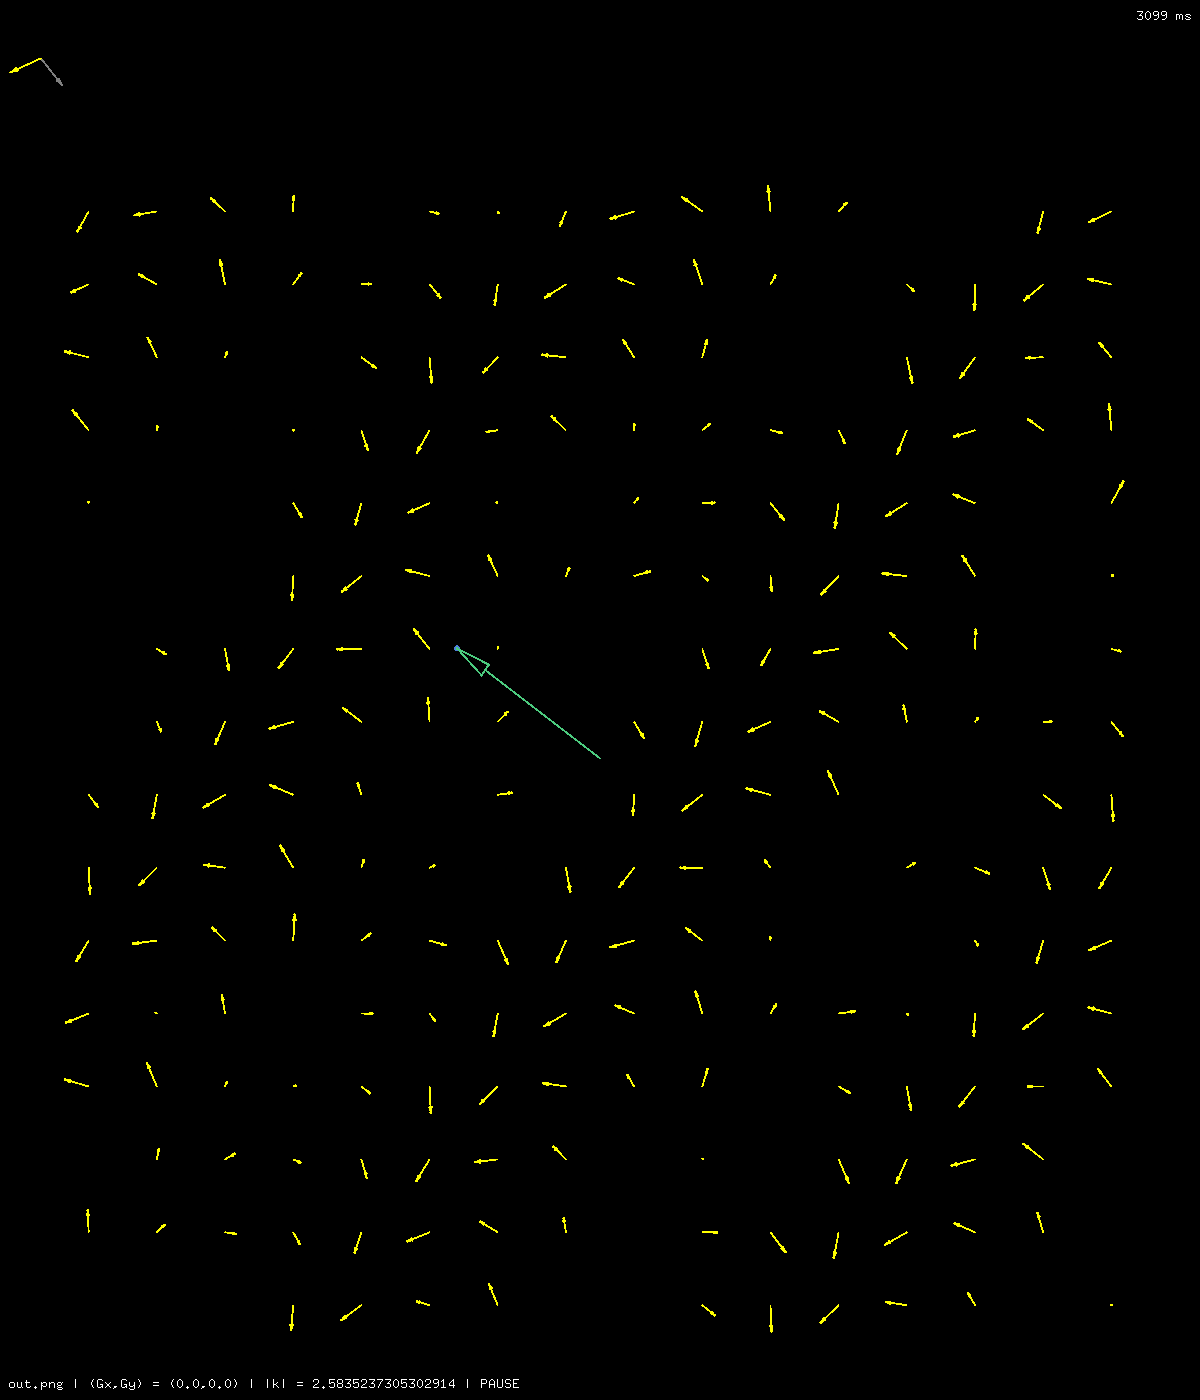
The images below (one with the T2 values and one without) show the phase shift caused by a gradient integral in the direction of the green arrow.
Note carefully how the gradient integral has caused phase shifts such that the peaks are 180$^o$ out of phase with the valleys.
Adding up all the individual moment vectors results in an aggregate moment in the direction shown by the small yellow arrow in the upper-left corner. (Ignore the grey arrow for now.)
Note how that yellow arrow is in the direction of the predominant moments on the peaks. Because the peaks generally have large T2 values and the valleys small T2 values, the valleys, even though they are 180$^o$ out of phase, do not subtract very much from the peaks.
As the protons precess, that aggregate moment will rotate in synchrony with the individual moments of the protons.


Here's the takeaway:
The magnitude of the aggregate moment under the influence of a gradient integral corresponding to wavevector $\mathbf{k}$ is the amplitude of the corresponding sinusoid that contributes to the MRI image.
Determining the phase shift
From above, we have the amplitude of the sinusoid with wavevector $k$ that contributes to the overall MRI image. But we still need its phase.
The sinusoid is represented with a cosine function, so it should have a peak exactly where it crosses the origin, regardless of its direction.
But the sinusoid above has its peak offset somewhat from this origin.
That offset is the phase shift of the sinusoid.
The peaks of our sinusoid are highlighted with violet lines below. The first peak in the direction of the wavevector is about 260$^o$ degrees out of phase from the origin (since the angular distance between peaks is 360$^o$). If the peak were on the origin, it would be 0$^o$ degrees out of phase.
How is this phase shift determined from the aggregate moment, which is the yellow arrow in the upper-left corner?
The phase shift is the amount by which the aggregate moment has rotated from the moment at the origin.
The gradient integral is zero at the origin, so the moment at the origin has been unaffected by any applied gradients. We know how that moment is oscillating (i.e. we know its phase), since its oscillation was induced by the original $B_1$ transverse RF pulse.
The moment at the origin is shown as the grey vector in the upper-left corner. If a moment vector were visible at the origin, it would have the same direction.
The aggregate moment (yellow vector in upper-left) is about 260$^o$ degrees from the moment at the origin (grey vector).
So the phase shift of the sinusoidal wave is about 260$^o$.
Summary
- To find the MRI image, we need to determine an amplitude and phase at each point, $k$, in the frequency domain. This amplitude and phase are stored as a complex number.
- To find the amplitude and phase at a particular point, $k$, we induce a gradient integral in the direction of $k$ with magnitude proportional to $|k|$. Then we measure the aggregate moment: its magnitude and its phase shift from the moment at the origin are the amplitude and phase that get stored.