A signal can be represented as a sum of its sinusoidal components. Here the signal, $f$, is red and the sinusoidal components are blue:
 [1D FT animation from wikipedia.org]
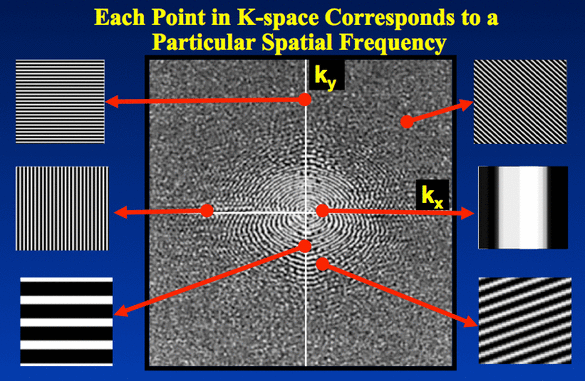
The magnitudes and phase (phase is not shown above) of the sinusoidal components form a "frequency space" representation of the same signal. This "frequency space" representation is shown as $\hat{f}$ above.
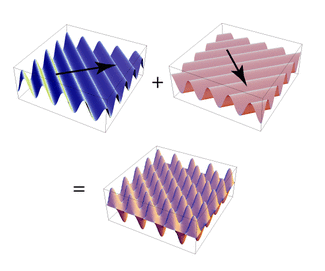
In 2D, the sinusoids are sinusoidal waves. The sum of all these sinusoidal waves at different frequencies results in an image:

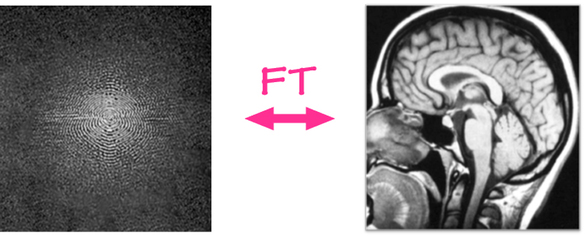
The Fourier Transform converts from one representation to the other, and back:

