Procedural Textures
With regular textures, $T(s,t)$ is determined by looking up a
value in the texture map. The lookup can use nearest neighbour,
bilinear, mipmaps, or even anisotropic filtering.
With procedural textures, $T(s,t)$ is determined by
calling a function, $f(s,t)$. The function might look up values
from textures and combine those values. The function is usually
in the fragment shader.
Perlin noise is a method to generate "natural looking" noise.
The addition of noise to a scene can make the scene look more
realistic.
The parameters of Perlin noise can be chosen to
approximate white noise, which has equal power at all
frequencies, or pink noise, which has power that is
inversely proportional to the frequency.
Here's a 2D Perlin noise texture:
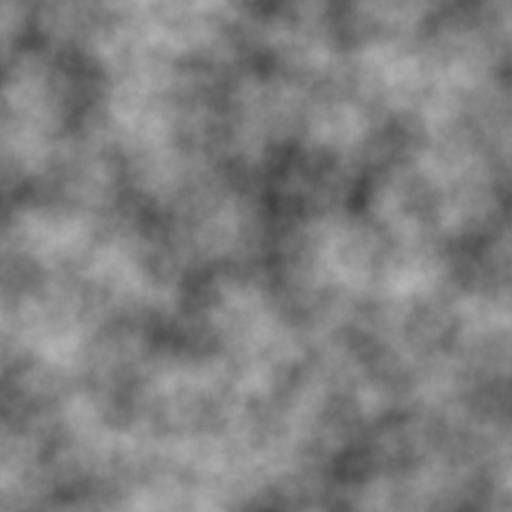
Example
Noise can be used to perturb the smooth shapes of
computer-generated geometry. In the following, the smooth
$P(s,t)$ texture is perturbed left and right by a random amount
at each pixel. The random amount is chosen by looking up a
value in a noise texture, $N(s,t)$:
$P'(s,t) = P( s + N(s,t), t )$

Computing $N(s,t)$
Start with random noise at a particular scale:
- Pick random points mid-way between regularly spaced
points. Use cosine interpolation to join the mid-way points
and the regular points:

This doesn't look very good.
- Pick random tangents at each regularly spaced point. Use
Hermite interpolation to join the regularly spaced points:

This looks better.
But the frequency of this noise (= the recipricol of the
wavelength) is fixed. How is a multi-frequency noise generated?
Let $f(s)$ be some fixed-frequency noise, generated as described above.
Then let the multi-frequncy noise be
$$N(s) = \sum_{i=0}^k { f( b^i s ) \over \large a^i } \qquad a,b > 1$$
As $i$ increases, ${1 \over \large a^i}$ decreases in amplitude.
As $i$ increases, $f(b^i s)$ increases in frequency.
$N(s)$ is a sum of copies of the original, fixed-frequency, noise function.
Example Noise
In the examples below, $a = 2$ and $b = 2$.
Each row below corresponds to a different value of $i$ in the sum
above. As $i$ increases (going downward in the graph below), the
amplitude decreases (due to ${1 \over a^i}$) and the frequency
increases (due to $f( b^i s)$).
Image from http://paulbourke.net/fractals/perlin/
In 2D, each parameter of the function is multiplied by $b^i$, like $f( \: b^i s, \; b^i t \: )$.

Image from http://paulbourke.net/fractals/perlin/
up to Schedule & Notes