up to Schedule & Notes

High Dynamic Range Photography

many figures below are from "High Dynamic Range Imaging: Acquisition, Display, and Image-based Lighting" by Reinhard, Pattanaik, Ward, and Debevec, 2006.

Dynamic range

Light "intensity" is measured as

Luminance can vary greatly in nature:

Dynamic range is the ratio between the brightest and dimmest light intensity. Different sensors are capable of sensing different dynamic ranges:

And output devices can be characterized by the dynamic range that they can output:

Colour Standards

Many standards exist to store colour values:
StandardBits per pixelDynamic range
of luminance
Relative step between adjacent
values of luminance
sRGB2410$^{1.6}$
RGBE3210$^{76}$1.0 %
LogLuv242410$^{4.8}$1.1 %
LogLuv323210$^{38}$0.3%

The dynamic range of sRGB above is from the brightest value possible to the brightest value at which the relative luminance between adjacent steps exceeds 5% and obvious banding occurs.

Exposure and Response Curve

The exposure of a pixel is the luminance impinging on that pixel times the duration over which the luminance is collected $$\mathrm{exposure} = L \; \Delta t$$

and can be meausured in "lux seconds".

A camera's response curve relates pixels value to exposures:

one measured response curve [Debevec & Malik 97]

response curves for R, G, B [Debevec & Malik 97]

So the radiance of any pixel can be found, knowing the response curve and exposure time, $\Delta t$, of the image.

Camera manufacturers know their response curve, and hardcode them in the camera, but don't reveal them.

Multiple images at different exposures

To find the radiance, take multiple images at different "exposure values", EV: $$EV = \log_2 {n^2 \over \Delta t}$$

for $n$ = f-number and $\Delta t$ = shutter speed.

Assume a perfectly still camera.

A pixel's radiance can be reliably known if it falls on the flat slope of the response curve.

For each pixel, exclude those images in which the pixel's value is at an extreme (i.e. saturated or at the noise floor).

Pick the pixel radiance as a weighted average of non-excluded pixels. Some weights:

Below is a house taken at three different EVs.

3 images of house at different EVs [ Reinhard, Pattanaik, Ward, Debevec 2006 ]

Below, the left image shows the source of each pixel's radiance (blue = large EV, green = medium EV, red = small EV). The right image shows the combined result with a histogram adjustment.

one image showing pixel source; other image showing combined result [ Reinhard, Pattanaik, Ward, Debevec 2006 ]

Remaining problems

Handling camera motion:

The camera will likely move between images, so we need to align correspoiding pixels in the different images.

The mean threshold bitmap is one method to align two images:

Variants can use gradient descent and multiscale techniques.

This method isnot sensitive to exposure or noise because the median is the same at different exposures.

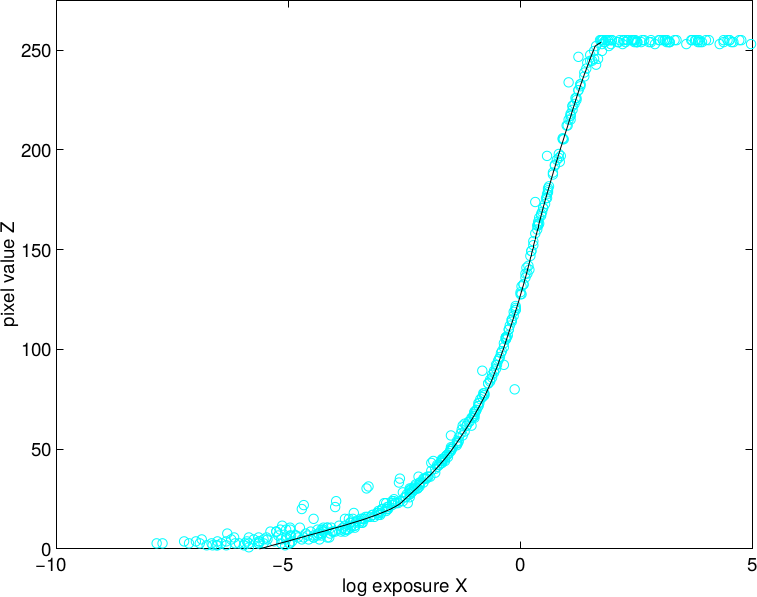
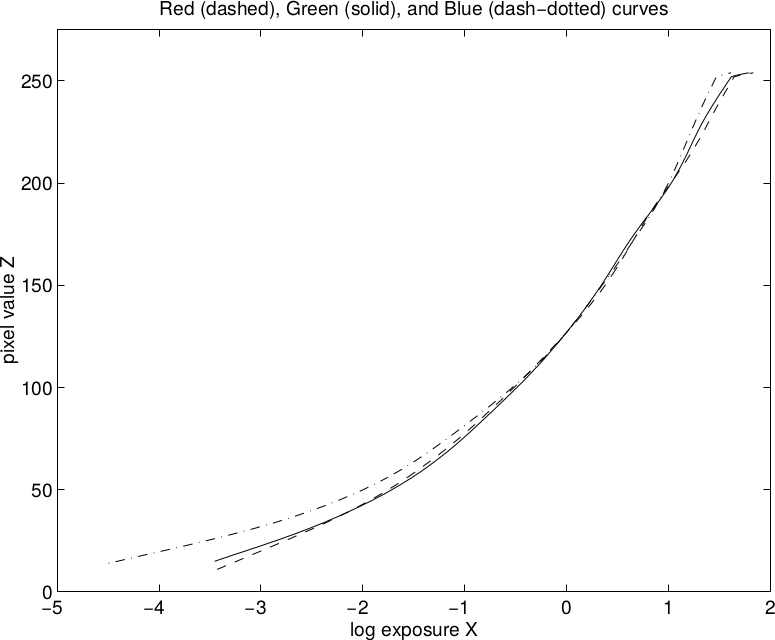
This method is independent of camera response, so it can be used to calculate the response curve.

This method is bad if many pixels are near the median. To avoid this, exclude pixels near the median.

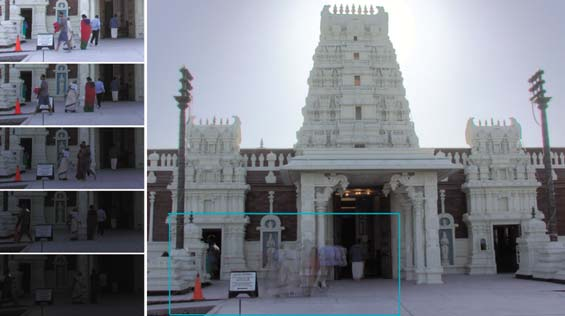
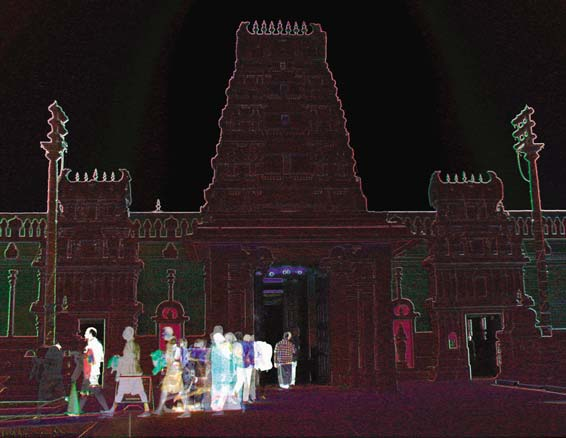
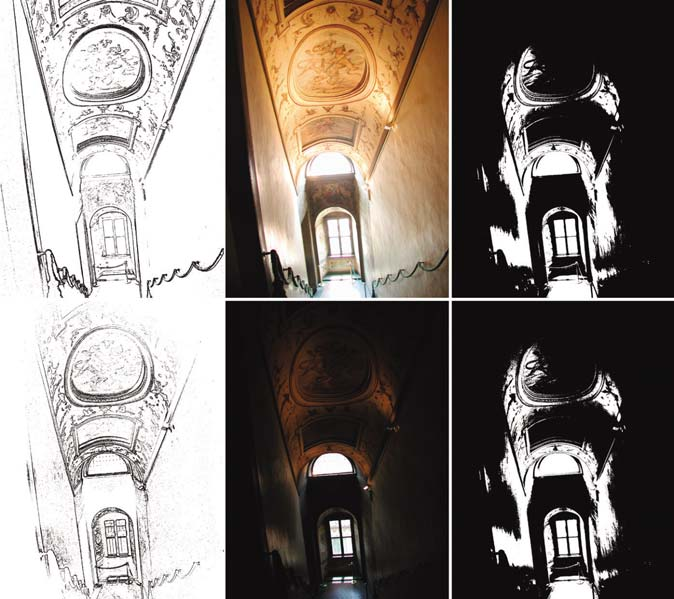
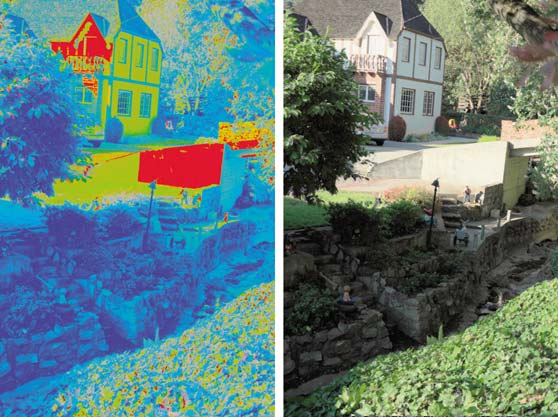
Below, the middle images are misaligned and at different exposures. The left image shows the edge bitmap, which is bad for alignment as different edges are visible at different EVs. The right image shows the mean threshold bitmap.

two images with MT bitmaps and edge bitmaps [ Reinhard, Pattanaik, Ward, Debevec 2006 ]

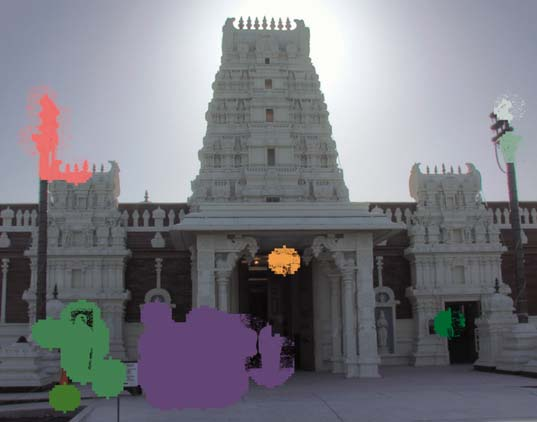
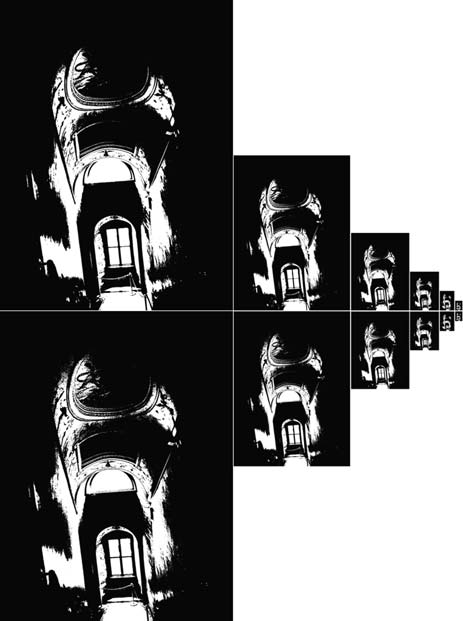
Below, is a multiscale respresentation of each image. Alignment is done quickly at the coarsest scale, then finer and finer scales are used.

multiscale image pyramids [ Reinhard, Pattanaik, Ward, Debevec 2006 ]

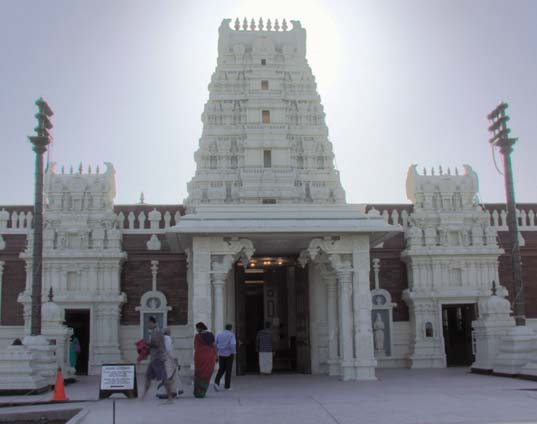
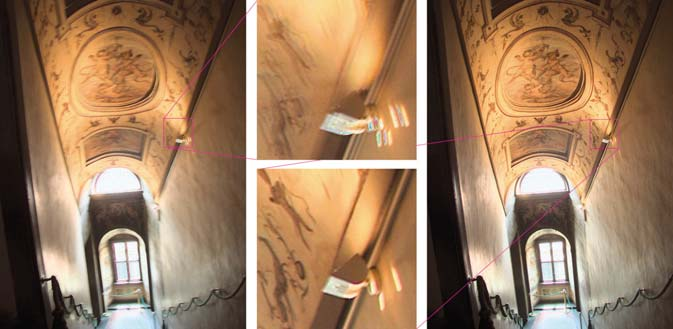
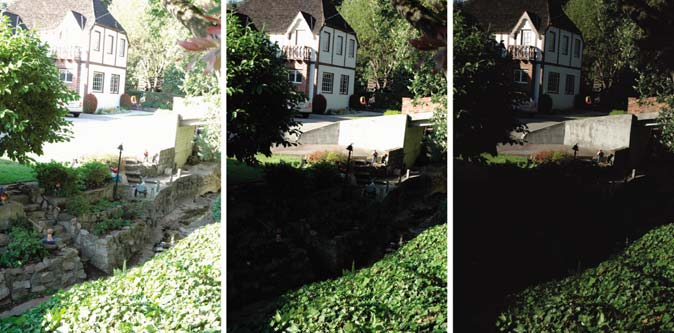
Below, the left image is composited from unaligned images, while the right image is composited from mean-threshold-bitmap aligned images.

comparison of motion compensation and none [ Reinhard, Pattanaik, Ward, Debevec 2006 ]

Determining the response curve

The camera manufacturers do not publicize their response curves, so we must determine them ourselves, as follows:

  1. Take 5 static photos at different EVs and look at the same pixel in each image: 5 images of a church interior [ Reinhard, Pattanaik, Ward, Debevec 2006 ]
  2. For a given pixel, assume that it has radiance = 1 in the first image. Note that $\Delta t$ is known.
  3. Plot that pixel value (0..255) at the 5 different EVs, which are known: plot of five pixels EV vs value

    Note that changing the initial radiance to a value other than 1 will move all points up or down.

  4. Repeat the above for each chosen pixel.
  5. Shift the pixel curves up or down to align them. Optimize to minimize differences between individual curves. resulting response curve [ Reinhard, Pattanaik, Ward, Debevec 2006 ]

Ghost removal

Ghosts are moving objects that appear in different places in the different images. Ghosts can be removed as follows:

Lens flare removal

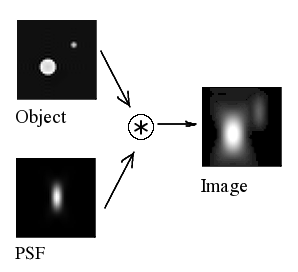
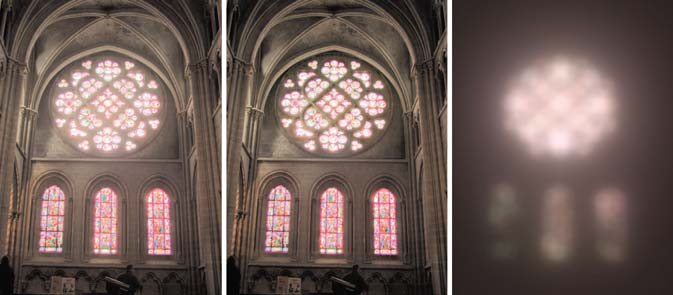
Lens flare is an area of the image near a bright spot that also gets brighter.

This occurs due to light scattering within the lens.

The flare can be defined by point-spread-function (PSF), which is the amount of light at each point in the image due to a point light source (ideally a radially symmetric PSF, but this doesn't happen in reality). a point spread function [Wikipedia]

Lens flare can be removed by estimating PSF around the brightest pixels of a reduced-resolution HDR image lens flare removed

up to Schedule & Notes